| Operator | Input Data | Description |
|---|---|---|
| AND | Fuzzy | Finds the AND value of the inputs (minimum value). |
| (previously OrNEG in EEMS version 1.0) | ||
| CONVERT TO FUZZY | Raw | Converts a field's values into fuzzy values. |
| Convert To Fuzzy Category | Raw | Converts a field's values into fuzzy values by using the user defined category values and matching fuzzy values. Input values that are not in the user defined categories are assigned the user-defined default fuzzy value. |
| EEMS Convert To Fuzzy Curve | Raw | Converts a field's values into fuzzy values for EEMS (Environmental Evaluation Modeling System), using linear interpolation between user defined points on an approximation of a curve. |
| Difference | Raw | Computes the difference sum for each row of the inputs. |
| EEMS EMDS And | Fuzzy | Fuzzy logic operator for EEMS (Environmental Evaluation Modeling System). Finds the EMDS AND value of the inputs. The formula is min + [(mean - min) * (min + 1) / 2] |
| Max | Raw | Finds the maximum for each row of the input fields. |
| Mean | Raw | Finds the mean for each row of the input fields. |
| Min | Raw | Finds the minimum for each row of the input fields. |
| Not | Fuzzy | Logical NOT for fuzzy modeling. Reverses the sign of values of the input field. |
| OR | Fuzzy | Finds the truest value of the inputs (maximum value). |
| SELECTED UNION | Fuzzy | Finds the union value (mean) of the specified number of TRUEest or FALSEest inputs. |
| SUM | Raw | Computes the sum of the inputs. |
| UNION | Fuzzy | Finds the union value of the inputs (mean value). |
| Weighted EMDS And | Fuzzy | Finds the weighted EMDS AND value of the inputs. The formula is min + [(mean - min) * (min + 1) / 2] where the mean is weighted. |
| WEIGHTED MEAN | Raw | Finds the weighted mean for each row of the input fields. |
| WEIGHTED SUM | Raw | Finds the weighted sum for each row of the input fields. Multiplies each field by its weight before adding. Like a weighted mean without the division. |
| WEIGHTED UNION | Fuzzy | Finds the weighted union (mean) for each row of the input fields. |
| XOR | Fuzzy | Finds the fuzzy EXCLUSIVE OR value of the inputs by comparing the two truest values. If both are fully true or fully false, false is returned. Otherwise it applies the formula: (truest value - second truest value) / (full true - full false) |
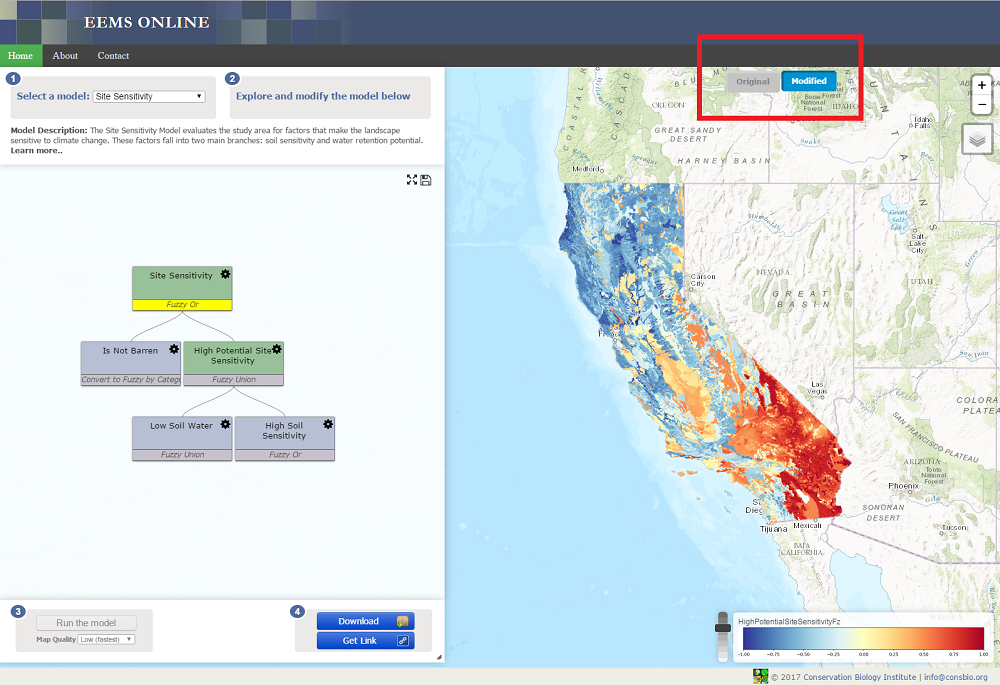
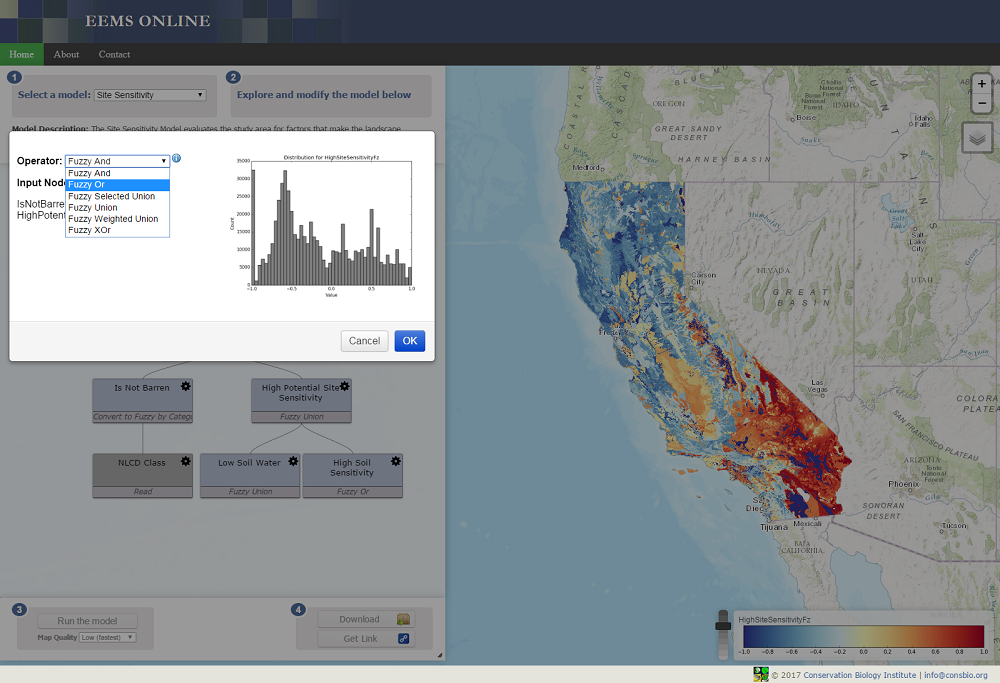
EEMS presents the user with choices for many operators and finding the right one can be confusing at first. The guidelines presented here will help you choose the right operator, but remember, sometimes it is best to experiment with several choices to make sure the operator you choose is appropriate for your model.
EEMS has operators designed to work on data before they are converted into fuzzy numerical space (i.e. when they are still in raw space) and those designed to work on data after they are converted into fuzzy space (see the above table). A user should respect that distinction. Using a non-fuzzy operator on fuzzy data can produce a result that falls outside the -1 to +1 continuum of fuzzy space. Doing this produces an invalid model.
Weighted Sum
The operators used in raw space are for the most part pretty straightforward. However the Weighted Sum operator merits a discussion. A Weighted Sum takes two or more inputs, and multiplies each of them by a weight before adding them. It has proven especially valuable with combining data of very similar types into one result that is then converted into fuzzy space. For example, if you were evaluating a region for intactness, the negative impact of paved roads might be considered similar to but greater than that of dirt roads. Their effects are additive, but a sum operator is not available in fuzzy space. To apply the Weighted Sum operator you might provide a weight of 1 to the paved road density and a weight of 0.5 to the dirt road density. In models that have done this, the result has been labeled “Effective Road Density.”
And, Or, and Union
And, Or and Union are the most common EEMS operators used. The choice between And, Or, and Union depends on the relationship of the input data to the question you are asking. Or returns the highest fuzzy value of any of the inputs, it is appropriate when any of the inputs is sufficient for your desired outcome. For example if you were evaluating a region in which three critically endangered species were present in some locations, you could use an Or to combine presence of species A, presence of species B, and presence of species C into high preserve value. The presence of any of the three species would cause a map reporting unit to have a high fuzzy value. And is used when all inputs are necessary for the result to be high. For instance, if both habitat for and presence of a species of interest were required to consider a location as a preserve, you could combine species presence and habitat density with an And to produce high preservation value. And chooses the lowest fuzzy value of the inputs so that high fuzzy values for both conditions are necessary to yield a high fuzzy value for the result. Union takes the mean of the input values. Union allows each input to exert an influence on the result. If all inputs have a high value, the result will have a high fuzzy value; if all have a low value, the result will be low. If some are high and some are low, the result will be somewhere in between. Going back to our preserve example, we know if the species is present, the location has value as a preserve. If the habitat is present there is some value, too. If they are both present then the value is the highest. Union will yield that result. A Weighted Union is similar to Union, except that it allows a weight to the inputs. In our preserve example, if habitat density is more important than species presence (for instance in an area where remnant populations are under stress and habitat has been restored in areas where the species has not been able to recolonize) then you could provide a greater weight to habitat density.
Selected Union
The Selected Union represents a combination of Or (or And) and Union. Consider a study area that includes many different types of habitat, for example, a basin and range terrain. Some species of concern are found in valleys, others inhabit the foothills, and others the high mountains. What if there are 30 species of concern? The more species of concern in a location, the more valuable the location, but nowhere are they all found together. The Selected Union allows for the evaluation of such a study area. With the Selected Union, you choose a number of the truest (or falsest) of inputs to evaluate. In the basin and range example, you might choose five. A location with a high density of five (or more) species of concern would have a high fuzzy value for high species diversity. As the density of species of concern falls, so does the fuzzy value for high species diversity. A Selected Union with a parameter of 5 Truest would do just that. It performs a Union operation on the five inputs with the highest fuzzy values.